How To Read A Chart Of A Stock

Ever scrolled through your phone or watched the news and seen those wiggly lines representing stock prices, wondering what on earth they mean? Well, you're not alone! Reading a stock chart might sound intimidating, but it's actually a super accessible and surprisingly fun skill to pick up. Think of it like learning to read a map – once you know the basics, it opens up a whole new world of understanding and even potential opportunities. It's become a popular pastime for many, a way to engage with the world of business and finance in a tangible way.
So, why bother learning to read a stock chart? For the absolute beginner, it's like getting a peek behind the curtain of how businesses perform. You can start to see patterns and understand the general buzz around a company without needing to be a financial whiz. For families, it can be a fantastic way to have engaging conversations about money, economics, and how the world works. Imagine pointing out a chart and saying, "See how this company's value went up after they released a new product?" It's practical learning that can spark curiosity. And for the hobbyist investor, it's the bread and butter! It's your primary tool for making informed decisions, spotting trends, and understanding the ups and downs of the market.
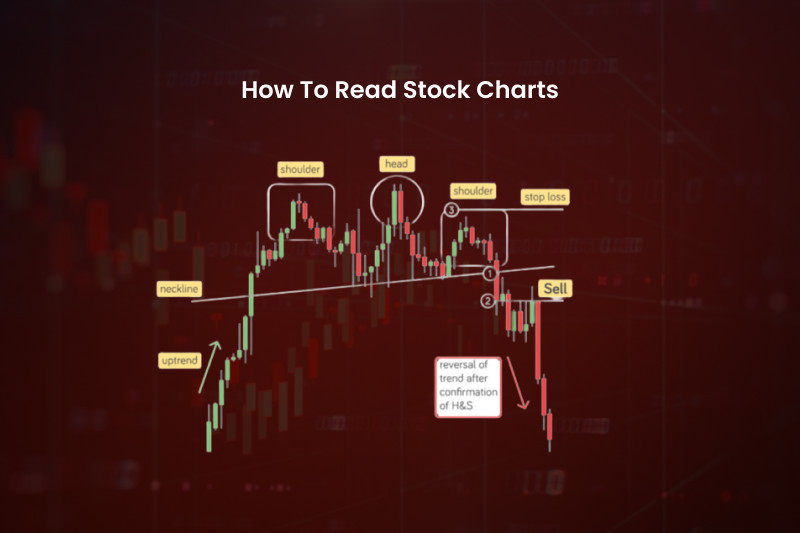
Stock charts come in a few main flavors, but the most common one you'll see is the line chart. This is the simplest – just a line connecting the closing price of a stock over a specific period. It's like a history book for a stock's value. Then you have candlestick charts, which are a bit more detailed. Each "candlestick" tells you the opening price, closing price, the highest price reached, and the lowest price for that period (usually a day, week, or month). If the candle is green (or white), it means the price went up; if it's red (or black), it went down. There are also bar charts, which are similar to candlesticks but use simple lines.
Must Read
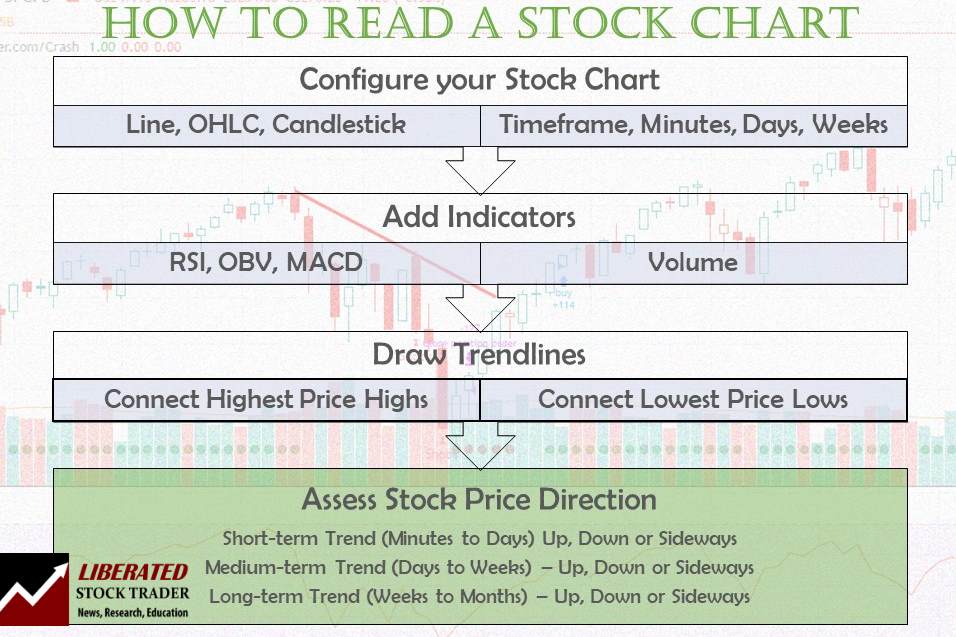
Getting started is easier than you think! First, find a stock you're curious about. Maybe it's a company whose products you use every day. You can find charts on most financial news websites, investment platforms, or even by doing a quick Google search for "[Company Name] stock chart." Look at the timeframe – are you looking at the last day, the last year, or the last decade? The longer the timeframe, the bigger the picture. Don't get overwhelmed by all the extra lines or numbers at first. Just focus on the main trend: is the line generally going up, down, or staying flat? Pay attention to the general direction.
Reading a stock chart is a journey, not a race. The more you look, the more familiar you'll become with what you're seeing. It's a fantastic way to demystify the stock market and gain a better understanding of how the economy functions. So next time you see those wiggly lines, don't shy away – give them a friendly glance. You might just discover a new interest and a valuable skill that’s both informative and genuinely engaging.