How To Get P Value On Excel
Ever gazed at a beautifully rendered chart or a data visualization that just clicked? There's a quiet magic at play, and often, a little helper named the p-value is involved. While it might sound like something exclusively for the lab coat crowd, learning to find and understand the p-value in Excel can unlock a surprising world of creative insights and fun for everyone!
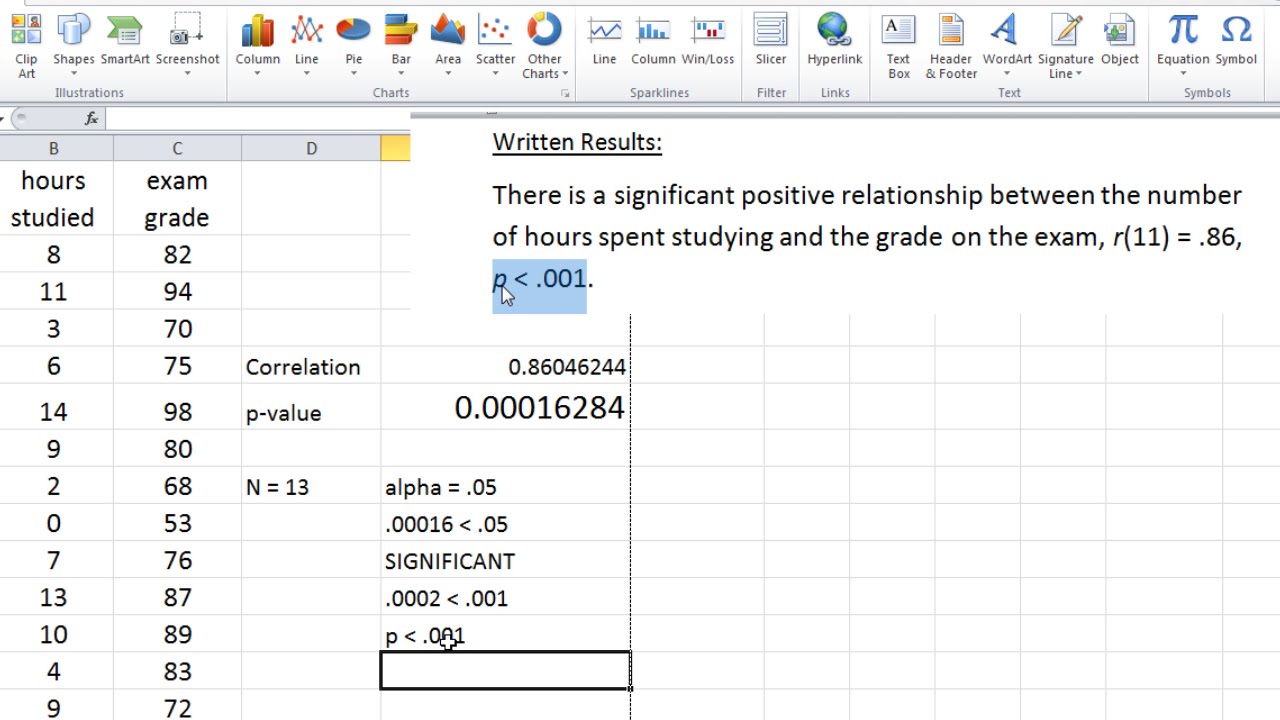
Think of the p-value as Excel's way of telling you how likely it is that your observed data happened by chance. For artists, hobbyists, and casual learners, this isn't about proving groundbreaking scientific theories. It's about making informed decisions in your creative projects, understanding the significance of your observations, and adding a layer of analytical depth to your passions.
Imagine a baker experimenting with two different recipes for their famous chocolate chip cookies. They bake batches of each and then, using Excel, they can calculate the p-value to see if there's a statistically significant difference in, say, the cookie height or the number of chips per cookie. Is the new recipe truly better, or is the difference just a fluke? The p-value helps answer that!
Must Read
Or perhaps a photographer analyzing the performance of different editing filters on their landscape shots. They might measure perceived "vibrancy" or "contrast" for images edited with Filter A versus Filter B. A low p-value would suggest that Filter A consistently produces a more desirable effect, not just in a single instance. Even a gardener comparing the growth rate of two types of tomatoes could use this to understand if one variety truly thrives better in their soil.
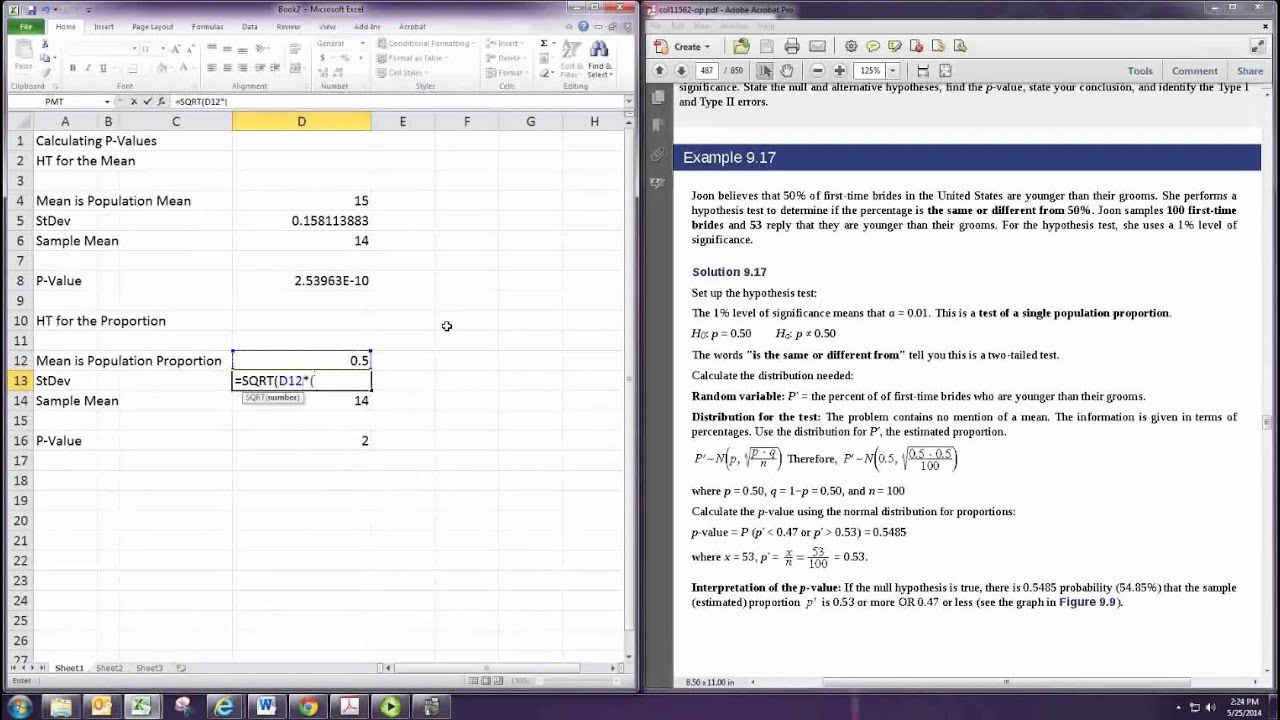
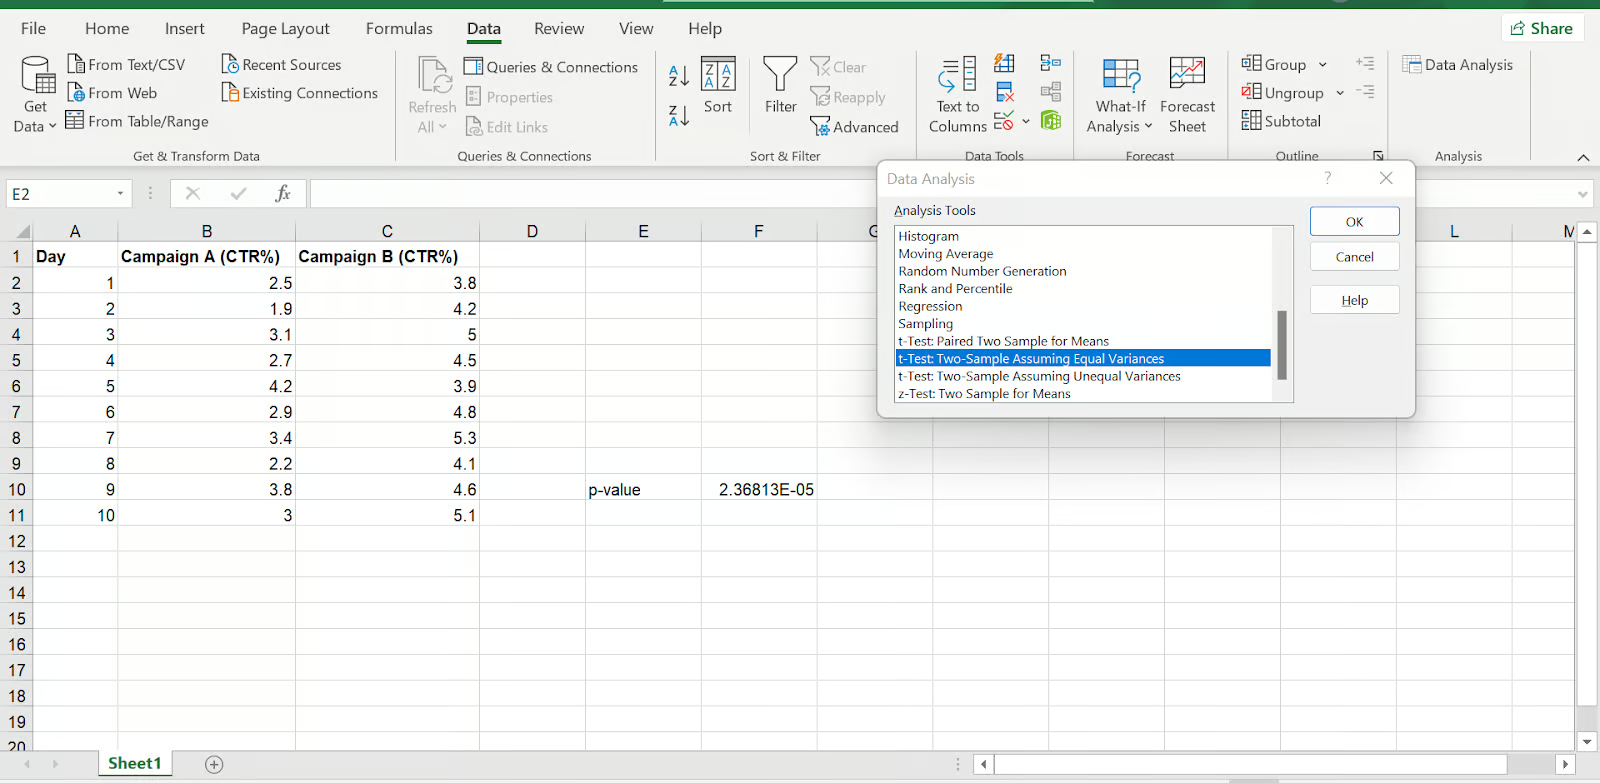
So, how do you actually get this mystical p-value in Excel? It's often found within the results of statistical tests. For instance, if you're comparing two groups (like our baker's cookies or the photographer's filters), you'd likely use the T-Test function. In Excel, you can access these through the 'Data Analysis' add-in (which you might need to enable first under File > Options > Add-Ins). Once enabled, you'll find options like 'T-Test: Two-Sample Assuming Equal Variances' or 'T-Test: Two-Sample Assuming Unequal Variances'. Simply select the appropriate test, input your data ranges, and Excel will output a table including the p-value!

Here are a few tips for trying it at home:
- Start Simple: Don't be intimidated. Begin with small datasets and straightforward comparisons.
- Focus on the "Why": Understand what you're trying to discover. Are you looking for a difference, a relationship, or something else?
- Visualize Your Data: Graphs and charts are your best friends. Plotting your data alongside your p-value analysis can make it much clearer.
- Experiment with Different Tests: As you get more comfortable, explore other statistical tests available in the 'Data Analysis' toolpak.
The beauty of using p-values in Excel isn't about complex statistical jargon; it's about adding a layer of objectivity and insight to your personal explorations. It’s a fun way to satisfy your curiosity, refine your skills, and perhaps even discover something truly noteworthy in your own backyard – or your own kitchen!