Nature Of Stationary Point

Hey there! So, ever feel like you’re just… stuck? Like life’s a bit of a rollercoaster, but you’re perpetually at the very top of that big hill, just hanging there, wondering when the drop is gonna happen? Yeah, me too. And guess what? Turns out, there’s a fancy math term for that feeling: a stationary point. Pretty cool, right? It’s like the universe’s way of saying, “Whoa there, hold your horses!”
Honestly, when I first heard about stationary points, I was picturing, like, a really boring rock. You know, just sitting there, not doing much. And in a way, that’s not far off! But in the world of calculus, it’s way more exciting than it sounds. Think of it like this: a stationary point is a spot on a graph where the function decides to take a breather. It’s not going up, and it’s not going down. It’s just… chilling. Like that one friend who always shows up late, but then just kind of hangs out in the corner, not really participating? That’s your stationary point right there!
So, how do we find these chill spots? Well, it all comes down to the derivative. Don’t let that word scare you! It’s just a fancy way of saying the slope of the graph at any given point. Imagine you’re skiing down a mountain. The derivative tells you how steep that slope is. If the derivative is positive, you’re going uphill (whee!). If it’s negative, you’re heading downhill (wheee!). But at a stationary point? The derivative is zero. Zilch. Nada. It’s perfectly flat. Imagine hitting a tiny, perfectly level patch on an otherwise crazy ski slope. That’s your stationary point, baby!
Must Read
And this is where things get really interesting. Because just because a point is flat doesn't mean it's the same kind of flat. Oh no. There are different flavors of stationary points, and they’re like the different moods of your favorite (or least favorite) celebrity. You’ve got your local maximums, your local minimums, and then there’s the one that’s just… awkward. The saddle point. We’ll get to that little drama queen later.
The Peak of Perfection (or Near Perfection): Local Maximums
Okay, so let’s talk about the good stuff first. Local maximums! These are the points where the graph reaches a little peak. Think of it like the highest point on a small hill. It’s not necessarily the absolute highest point ever on the whole graph, but it’s the highest point in its immediate neighborhood. Like that one amazing donut at the bakery. It’s the best donut that day, but maybe the bakery will have even better donuts tomorrow. You get the idea.
Imagine you’re charting the temperature in your city over a year. There’ll be a day where it’s the hottest – that’s your local maximum for that year. Or maybe you’re tracking the price of your favorite stock. It might hit a high point, then dip a bit, then maybe go even higher later, but that first high point was still a significant peak. These are the moments of glory, the little victories in the grand scheme of things. They’re the aha! moments in a function’s journey.
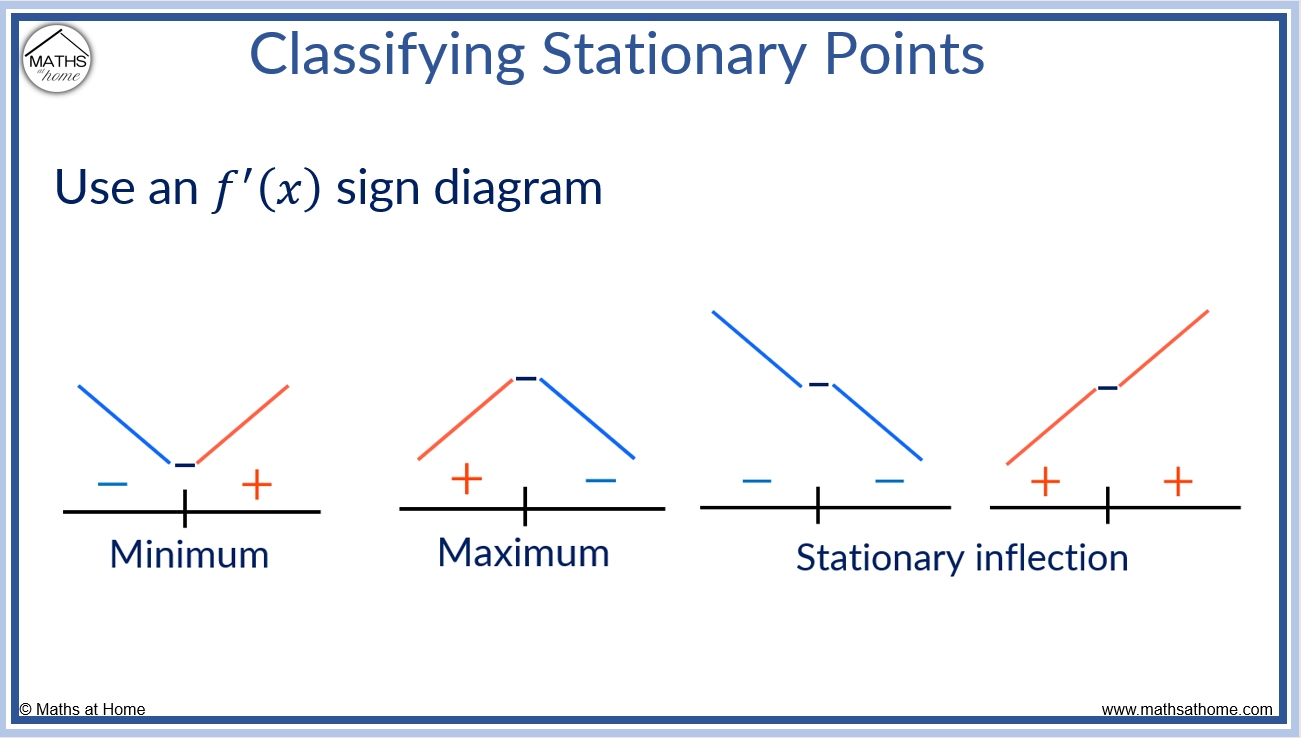
Mathematically, at a local maximum, the derivative is zero. But what happens just before and just after? Before the peak, the slope is positive (going up, up, up!). After the peak, the slope turns negative (coming down, down, down!). So, the derivative goes from positive, hits zero, and then becomes negative. It’s like a little U-turn on the graph, but a very neat, very precise U-turn. Super satisfying, if you ask me.
It’s all about those “peaks.” If you’re looking at a roller coaster graph, the top of the big hill? That’s a maximum. Or if you’re looking at how many people are online at any given time, there might be a peak in the evening when everyone’s home from work. These are the highs. The moments where things are, at least temporarily, at their best. It's like hitting the jackpot, but for math. Pretty sweet deal.
The Valley of Despair (or Just a Low Point): Local Minimums
Now, let’s flip it. We’ve got the peaks, so we must have the valleys, right? These are the local minimums. Think of the lowest point on a small dip. It’s the lowest in its immediate surroundings, but again, not necessarily the absolute lowest the graph will ever go. It’s like that one slightly-less-than-perfect donut that’s still pretty darn good. Or, you know, the lowest point in your mood on a Monday morning. We’ve all been there.
If temperature is our game, a local minimum would be the coldest day of the year. Or for that stock price, it could be the lowest it dips before hopefully bouncing back. These are the moments where things take a bit of a tumble. Not necessarily a disaster, but a definite dip. It’s the point where you might be thinking, “Okay, can we go up from here?” And often, the answer is yes!
Just like with maximums, the derivative at a local minimum is zero. But the slopes on either side are different. Before the valley, the slope is negative (going down, down, down!). After the valley, the slope becomes positive (going up, up, up!). So, the derivative goes from negative, hits zero, and then turns positive. It's like a little valley shape, a neat little dip. This is the universe saying, “Okay, you’ve hit rock bottom, time to get back up there!”
It's all about those “valleys.” If you’re looking at the cost of producing something, there might be a point where the cost is minimized. Or if you’re looking at the number of errors in a software program, you’d hope to find a minimum error rate. These are the lows. The points where things are, at least temporarily, at their worst. It's like… well, it's the opposite of hitting the jackpot. But still important!
The Awkward Middle Child: Saddle Points
Ah, the saddle point. This one’s a bit of a wild card. It’s a stationary point, meaning the derivative is zero, but it’s neither a local maximum nor a local minimum. It’s like that person at a party who’s standing awkwardly in the middle of the room, not really talking to anyone, and you’re not sure if they’re about to join a conversation or just… evaporate. True drama!
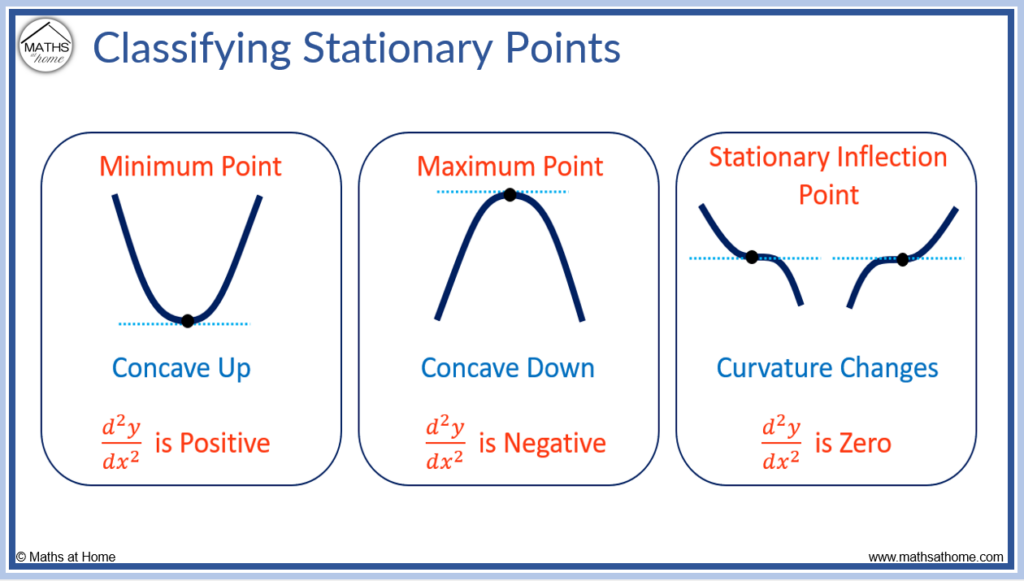
Imagine you’re on a horse. A saddle has a high point in front of you and a high point behind you, but a dip in the middle where your legs go. That’s kind of what a saddle point looks like on a graph, especially in higher dimensions. In 2D, it often looks like a curve that flattens out momentarily but then continues in the same general direction (up or down). It’s like a road that’s momentarily flat before it starts going uphill again, or a slight dip that then continues downhill. It’s that moment of uncertainty.
Mathematically, at a saddle point, the derivative is zero. But here’s the kicker: on one side, the slope might be positive, and on the other side, it's still positive (or negative on both sides). It's like a point where the function momentarily stops changing, but then immediately resumes its movement in the same direction. It doesn’t decide to turn around like a maximum or minimum; it just pauses for a dramatic effect before carrying on. It’s the plot twist nobody saw coming!

These are the points that can really throw you off. You think you’ve found a peak or a valley, you do the math, and bam! Saddle point. It’s the mathematical equivalent of a red herring. In real-world applications, they can represent tricky situations. For instance, in economics, a saddle point might represent a point of unstable equilibrium, where any small nudge can send the system in one direction or another. It’s a moment of indecision for the system.
Think about a mountain range. You can have individual peaks and valleys, but there are also passes between mountains. Some of those passes might feel momentarily flat, but they're not the absolute highest or lowest point in the vicinity. They're just… a passage. A saddle point can be that seemingly flat passage. It’s neither the summit nor the valley floor, just the in-between. It’s a bit of a mathematical enigma, really.
Why Do We Care? The Big Picture Stuff
So, why should you care about these stationary points? Well, they’re everywhere! Seriously. They’re the turning points in life, the moments where things change direction. Understanding them helps us understand how things behave. Whether it's predicting the weather, figuring out the best way to design a bridge, or even just understanding how a population grows (or shrinks!), stationary points are the key players.
In optimization problems – like finding the absolute best or worst case scenario – stationary points are your starting point. You find all the potential maximums and minimums (including the global ones, which we haven’t even touched on because, let’s be honest, this coffee’s getting cold!), and then you compare them. It’s like a mathematical treasure hunt, and the stationary points are the clues.

Think about it this way: if you’re designing a new airplane wing, you want it to be as aerodynamic as possible. That means finding the shape that minimizes drag. Where do you start looking for that optimal shape? At the points where the drag function is neither increasing nor decreasing – the stationary points! It's all about finding those critical moments where the function’s behavior is about to change.
And it’s not just about the big, fancy engineering stuff. Even in everyday life, we make decisions based on similar principles. When do you decide to sell a stock? Probably when you think it’s at its peak, right? When do you decide to buy? Maybe when it’s at its lowest. You’re intuitively looking for those stationary points, those turning points in the market. You just might not be using calculus to get there!
The beauty of calculus is that it gives us a precise language to describe these phenomena. It allows us to analyze change and identify critical moments with incredible accuracy. So, the next time you see a graph that goes up and then down, or down and then up, remember those little spots where it leveled out. Those are your stationary points, the silent heroes of the mathematical world, quietly dictating the twists and turns of our functions and, perhaps, even our lives!
It’s like the universe whispering its secrets. And stationary points are just one of those secrets. They’re the places where the action might be happening, the potential turning points. So, whether it’s a glorious peak, a humble valley, or an awkward pause, these points are worth knowing about. They’re the punctuation marks in the sentences of our functions. And without them, well, things would be a whole lot flatter, and probably a lot less interesting. Thanks for joining me for this little coffee chat about math! Until next time, keep an eye out for those stationary points in the wild!