How To Work Out Profit And Loss
Hey there, friend! So, you've been dabbling in something that's making you a little bit of money, or maybe even costing you a little bit. That's awesome! Whether it's a side hustle, a small business, or just your personal investing journey, understanding your profit and loss is like knowing the score of your favorite game. It tells you if you're winning, losing, or just kinda… playing. And guess what? It’s not as scary as it sounds! We're gonna break it down, nice and easy, like sharing a pizza. No jargon, no fancy accounting degrees needed. Just plain old common sense. Ready?
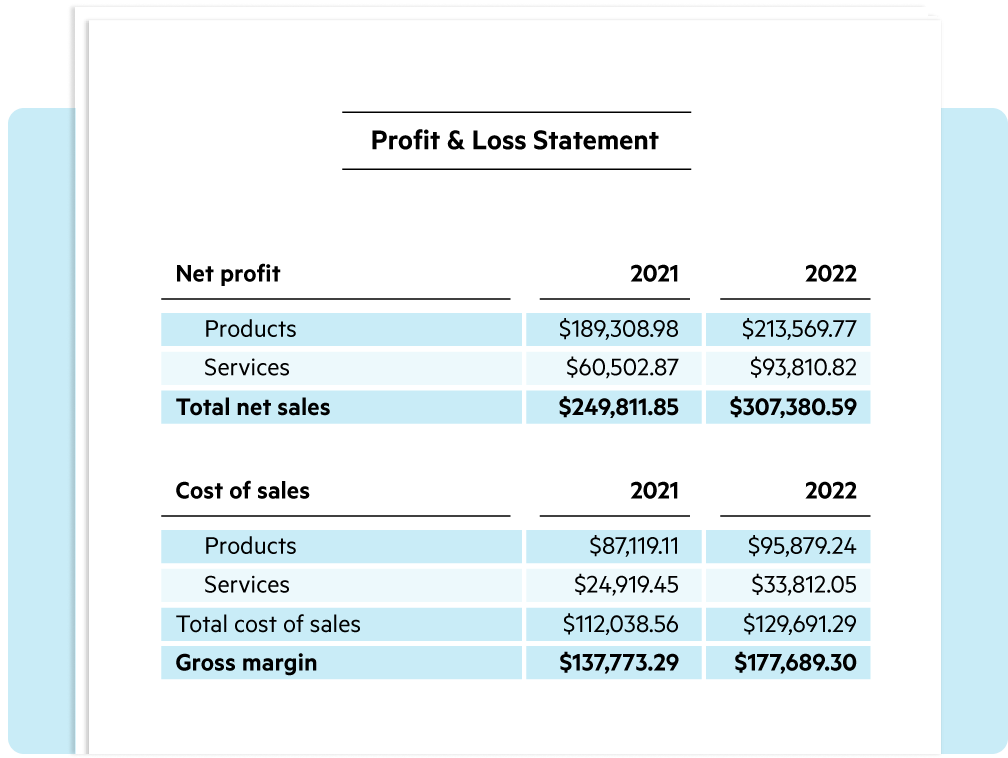
Think of profit and loss (often shortened to P&L, because accountants love their acronyms, right?) as your financial report card. It’s a snapshot that tells you how well you’ve been doing financially over a certain period. Did you make more than you spent? Hooray for profit! Did you spend more than you made? Oops, time to take a peek!
Let’s start with the fun stuff: Revenue. This is basically all the money that comes in. It’s the dough you’ve earned from selling your amazing products, providing your super-duper services, or maybe even from those stocks you’ve been holding onto. Think of it as the grand total of everything your customers or clients have paid you. If you’re selling artisanal dog biscuits, your revenue is the total cash from all those happy pups’ owners!
Must Read
Now, while revenue is great, it’s not the whole story. You gotta spend money to make money, as they say. And that brings us to Expenses. These are all the costs you incur to keep your business or venture going. Everything you pay out. This can be a loooong list, so let’s break it down into a couple of handy categories.
First up, we have Cost of Goods Sold (COGS). This is a biggie for anyone selling physical products. It's the direct cost of creating what you sell. So, for our dog biscuit entrepreneur, COGS would include the cost of the flour, the organic peanut butter, the free-range eggs, and maybe even the cute little bags you package them in. It's everything that goes into making that specific biscuit. If you’re selling services, this might be a bit different, but think about the direct costs associated with delivering that service. For a graphic designer, maybe it's the software subscription directly used for client projects.
Then, we have Operating Expenses (OpEx). This is like the general overhead, the stuff that keeps the lights on and the business humming, but isn't directly tied to creating a single product. This is where things like rent for your (imaginary) dog biscuit bakery come in. Your utilities (electricity, water – gotta keep those ovens running!), marketing and advertising (gotta tell people about those delicious biscuits!), salaries for any employees (your trusty biscuit tasters!), office supplies, insurance, and even those website hosting fees. Basically, if you pay for it regularly to keep things running, it's likely an operating expense. Think of it as the price of admission to the business game.
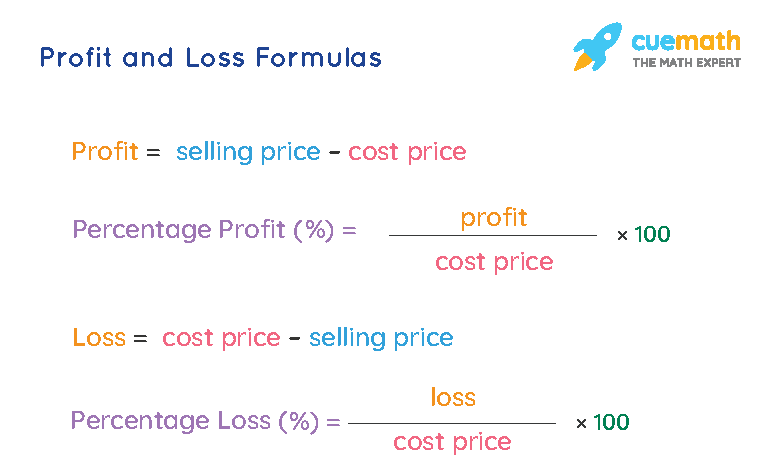
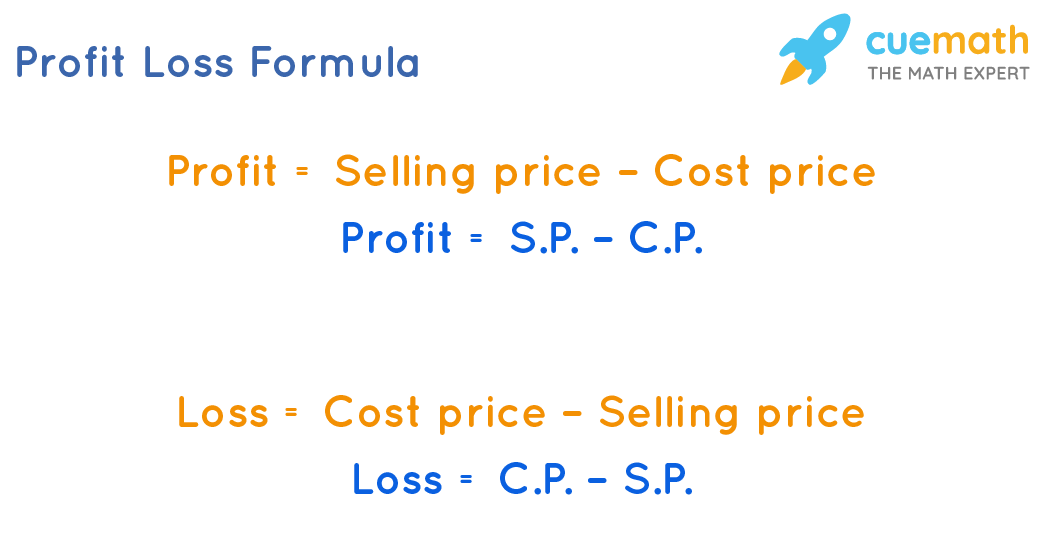
Okay, so we've got money coming in (Revenue) and money going out (Expenses, split into COGS and OpEx). Now, let’s put it all together to find our Gross Profit. This is a super important number! To calculate it, you simply take your Revenue and subtract your Cost of Goods Sold (COGS).
Gross Profit = Revenue - Cost of Goods Sold
This tells you how much money you’re making from the actual selling of your goods or services, before you even think about all those other running costs. It’s like knowing how much you’re earning per biscuit sold, ignoring the rent for a sec. A healthy Gross Profit is a good sign that your pricing is on point and your production costs are under control. If your Gross Profit is looking a bit… thin, it might be time to see if you can charge a little more for your amazing creations, or if there’s a cheaper way to source your ingredients.

But wait, there’s more! Gross Profit is great, but it doesn't tell the whole story. We still have those pesky Operating Expenses to account for. This is where we get to our grand finale: the Net Profit. This is the real bottom line, the money that’s actually left in your pocket (or bank account) after all your expenses have been paid. It’s the sweet, sweet reward for all your hard work!
To find your Net Profit, you take your Gross Profit and subtract your Operating Expenses (OpEx).
Net Profit = Gross Profit - Operating Expenses
And there you have it! Your Net Profit. If it’s a positive number, congratulations, you’ve made a profit! Cue the confetti! If it’s a negative number, well, that’s a Net Loss. Don’t panic! It’s not the end of the world. It’s just information, a friendly nudge to take a closer look.
Let’s make this super clear with a super simple example. Imagine you’re selling homemade lemonade at a summer fair.
Your Revenue: You sold 100 cups of lemonade at $2 a cup. Total Revenue = 100 cups * $2/cup = $200.
Your Expenses:
Cost of Goods Sold (COGS): * Lemons: $20 * Sugar: $15 * Water: $5 (You’re using tap water, keeping it budget-friendly!) * Cups: $10 Total COGS = $20 + $15 + $5 + $10 = $50.
Operating Expenses (OpEx): * Booth rental at the fair: $30 * Ice: $5 (Okay, maybe ice is a COGS for lemonade, but let’s put it here for simplicity’s sake today. See, accounting can be flexible! wink ) * Your dazzling smile and charming sales pitch: Priceless! (But we can’t put that on a spreadsheet.) Total OpEx = $30 + $5 = $35.
Now, let’s crunch those numbers!
Gross Profit: Revenue - COGS = $200 - $50 = $150.
So, you made $150 just from the lemonade itself. Not bad for a sunny afternoon!
Net Profit: Gross Profit - OpEx = $150 - $35 = $115.

Boom! Your Net Profit is $115. You made $115 from your lemonade stand! That’s fantastic! You can now use that $115 to buy more lemons for next time, or maybe treat yourself to an ice cream. You earned it!
What if, in our lemonade example, the fair was a total washout, and you only sold 20 cups?
Revenue: 20 cups * $2/cup = $40.
COGS: Still $50 (you had to buy all those ingredients anyway, right?).
OpEx: Still $35 (the booth rental doesn’t care if it rained cats and dogs).
Gross Profit: $40 - $50 = -$10 (Uh oh, a negative Gross Profit! You lost $10 just on the lemonade itself.)
Net Profit: -$10 - $35 = -$45.

In this scenario, you have a Net Loss of $45. You spent $45 more than you earned. This is where the P&L report card really helps. It shows you, "Hey, that lemonade stand didn't go as planned this time." Instead of feeling discouraged, you can look at it and say, "Okay, next time, I need to either sell more, or perhaps find a cheaper way to get my lemons and sugar if I’m not selling enough."
It’s also super useful to track your profit and loss over time. Are you generally making a profit? Is your profit growing? Or are your losses getting smaller? This trend analysis is incredibly valuable. It’s like watching your fitness tracker – you can see if you’re getting stronger or if you need to adjust your workout routine.
For businesses, this is usually done on a monthly, quarterly, or annual basis. For your personal investments, you might look at it more often, or whenever you make a significant transaction. The key is consistency. Pick a timeframe and stick with it.
Why is this so important? Well, for starters, it tells you if you're actually making money! Shocking, I know. It helps you make informed decisions. Should you invest more in this particular venture? Should you cut your losses on something that's consistently draining your funds? Is that expensive coffee habit really worth the hit to your personal "profit" for the month?
It also helps with setting realistic goals. If you know your average profit margin, you can set targets for future sales and growth. And if you ever decide to get super official and, you know, really start a business, banks and investors will absolutely want to see your P&L statements. They’re the financial handshake of the business world.
Don't get overwhelmed by all the numbers. At its heart, profit and loss is just about simple arithmetic: what came in versus what went out. You are already a master of this in your daily life – you know if you have enough money for that fancy gadget after paying your bills! This is just a slightly more structured way of looking at it, which gives you more power and clarity.
So, take a deep breath. Grab your calculator (or your trusty spreadsheet, or even just a piece of paper and a pen). Start with your revenue. Then, honestly list out your expenses. And then, the magic happens – you calculate your profit (or loss!). It's a journey of discovery, a way to understand your financial narrative better. Every number you calculate, every insight you gain, is a step towards greater financial control and success. And that, my friend, is something to smile about. Keep on track, keep on learning, and keep on winning!